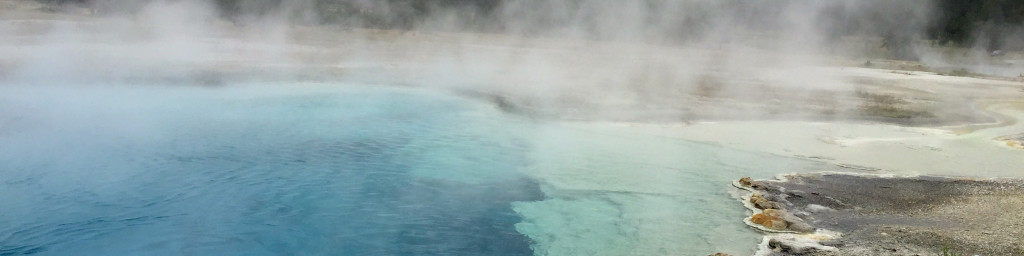
Image credit: Shelly Fiabane
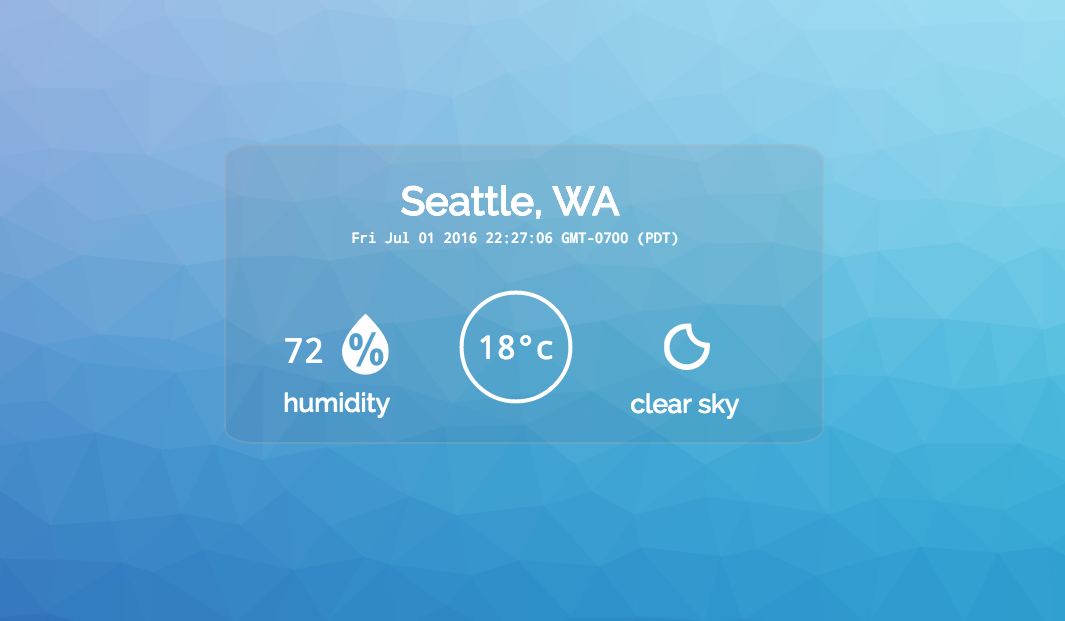
Local Weather App (Part 1)
Project Objectives:
- Create an app using the Open Weather API, and geolocation to display the user’s current weather conditions.
- Enable the background or an image to change based on conditions returned from the API call.
- Allow the user to toggle between Fahrenheit and Celsius.
See the live project here
Since the final product ended up being more complex than the required objectives, I chose to break down the project's steps over a series of blog posts.
First Objective: Enable background/image changes
Upon reading through the objectives, this was a really appealing aspect of the project. Creativity is the name of the game for this app. A plan developed in my mind to dynamically generate a multi-dimensional image for each set of weather conditions, instead of simply using a static image.
Background Image Colors:
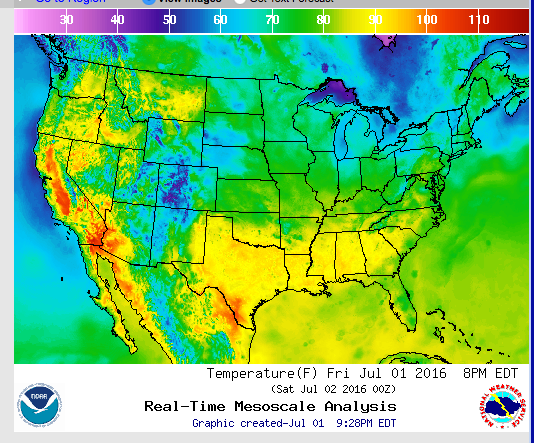
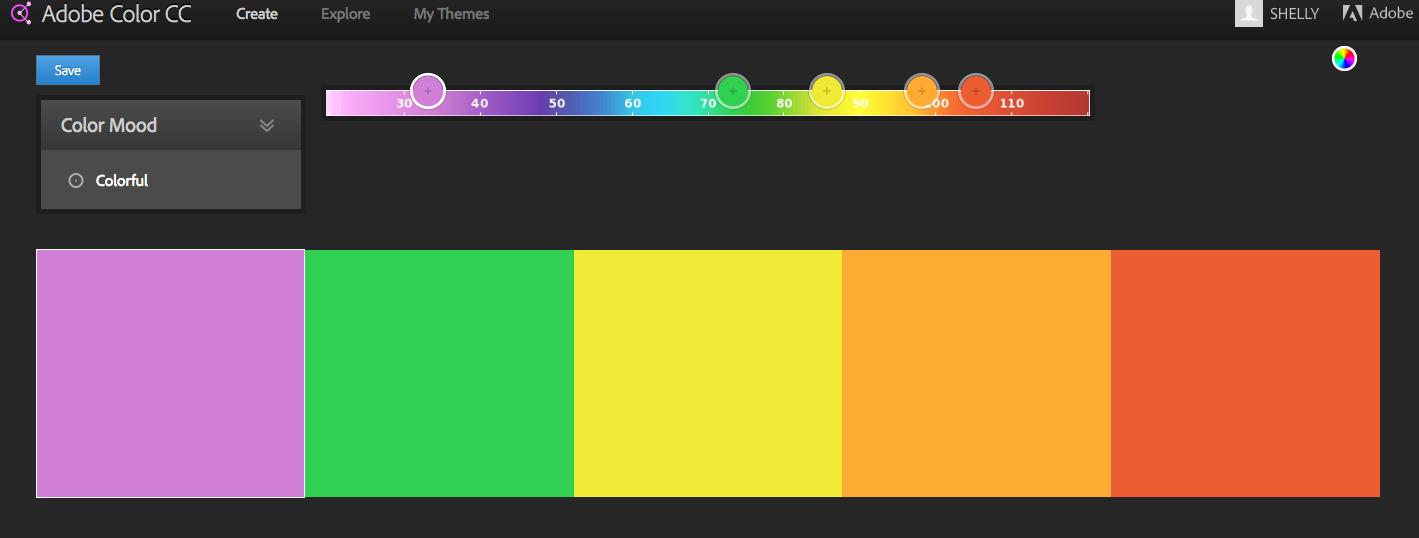
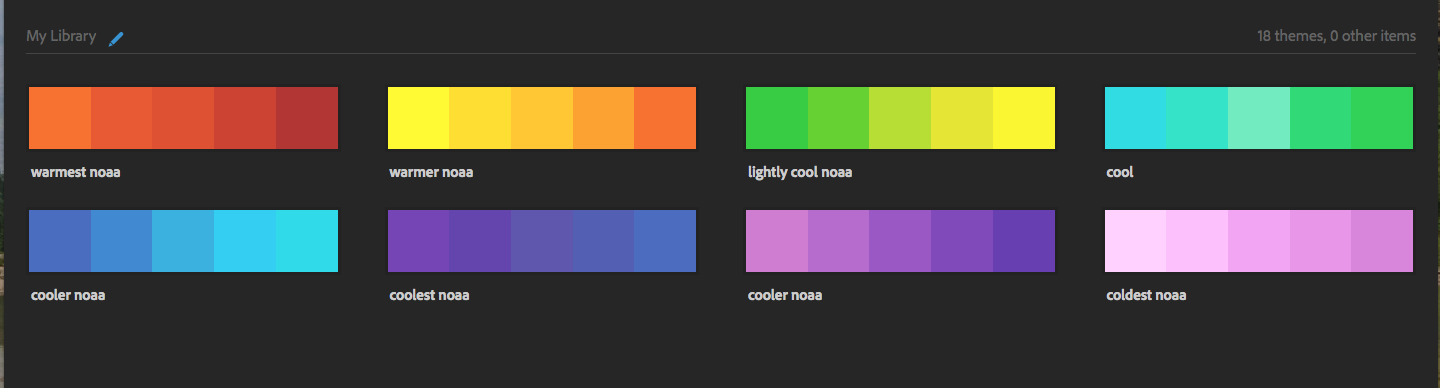
A tool which proved invaluable right from the start was Adobe ColorCC. It's use is fairly straightforward. A user can create custom color palettes from an uploaded image, or chose from existing palettes created by other users. A series of custom color palettes were put together drawing upon the NOAA color key for inspiration.
Trianglify, Chroma JS, and Color Brewer:

Click to try the Trianglify Generator
After completing the color palettes, It was time to create my background images. Trianglify is a really fun Javascript add-on which algorithmically generates triangle art utilizing HTML5 Canvas. I came into the project completely unfamiliar with Canvas, so I was prepared for a steep learning curve.
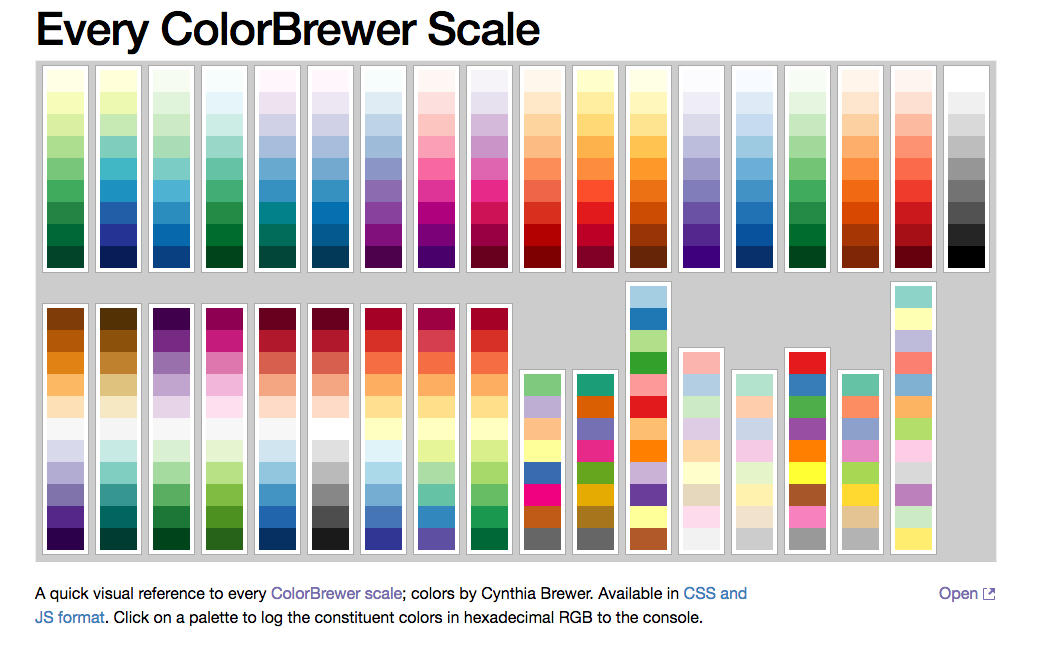
While reading the (very thurough) documentation, I learned Trianglify would accept a custom color palette for both the x and y axis. I wanted to achieve a gradient effect similar to the Color Brewer Scale to represent my data points.
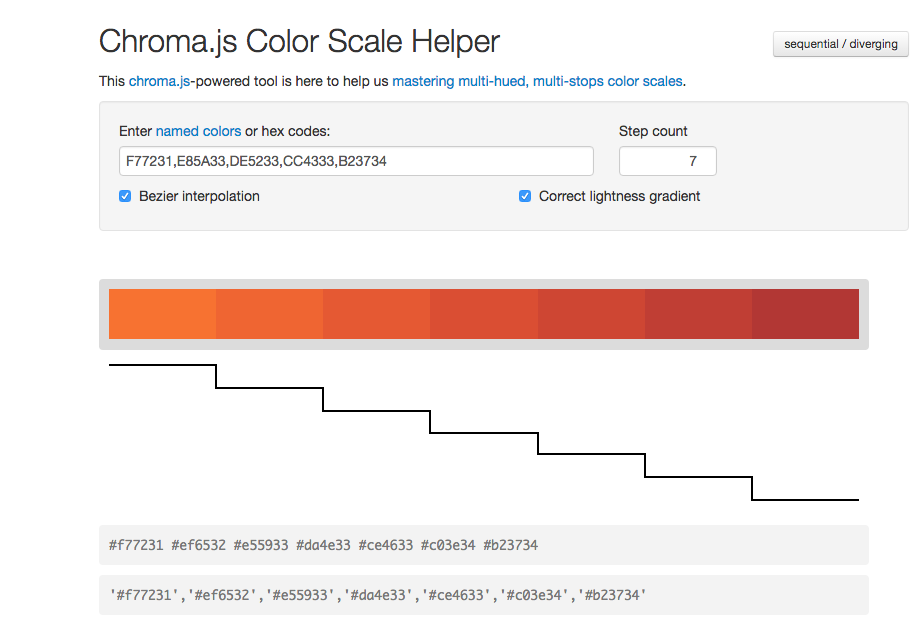
It became necessary to add more colors to achieve proper gradients. Visual appeal in the end product was very important as well. I found Chroma Js to be a perfect solution. Chroma JS is a color manipulation library and has an interactive tool as well. Using this tool allowed me to keep the JS light.
The Final Color Schemes:
Each final color palette was based on a temperature range represented in the NOAA color key shown above. The hex colors derived from Chroma.js were nice, yet still seemed a little bland. After testing many different hex codes the final product was a combination of my custom palettes and some Color Brewer ones.


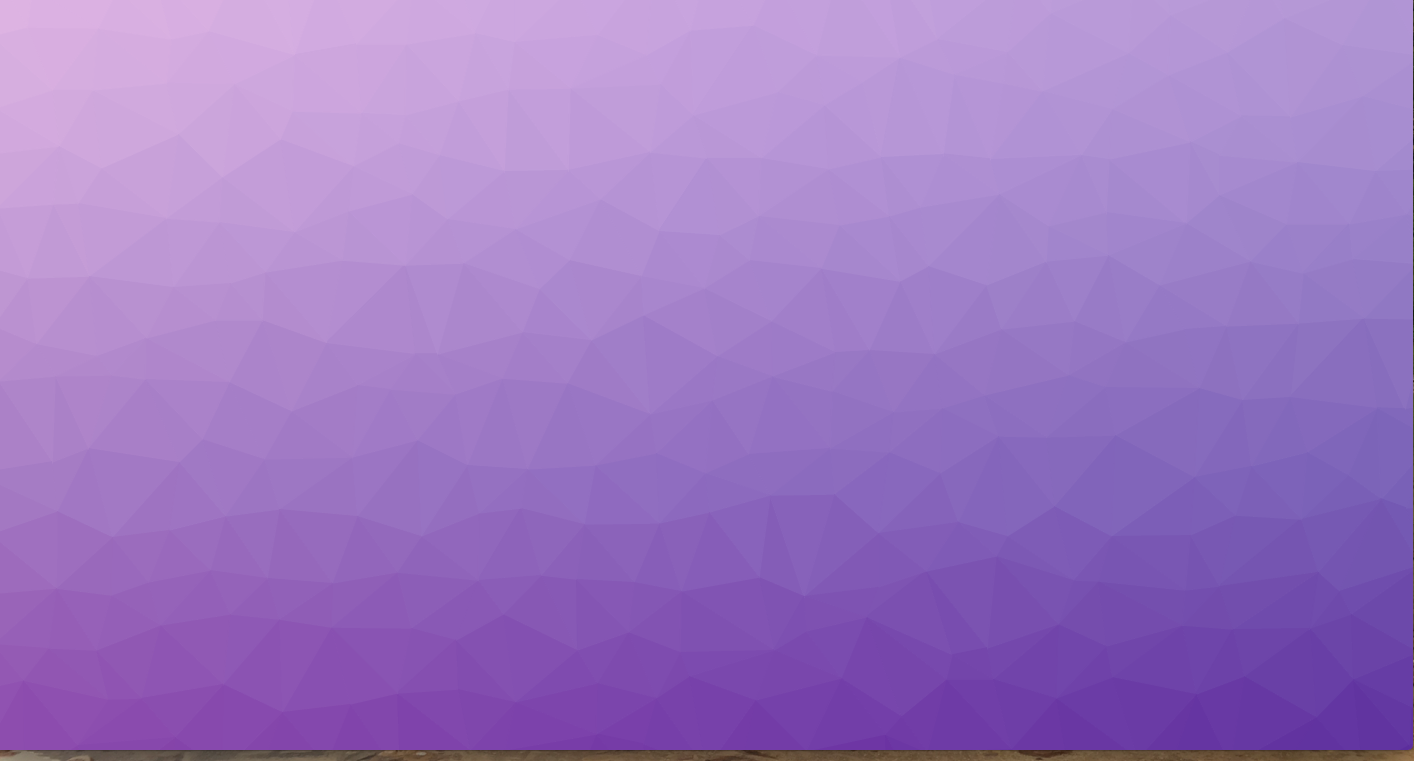

The individual color palettes were coded as demonstrated below. The resulting image is dynamically generated based on user data returned by the API call which reflects the current temperature range at their location, either in F° or C°.
var midPurple = Trianglify({
  cell_size: 60,
  variance: 0.74,
  width: window.innerWidth,
  height: window.innerHeight,
  x_colors: ['#cf7dd1', '#c274ce', '#b56bcb', '#a762c8', '#9958c4',
    '#8d51bf', '#804bba', '#7445b5', '#683fb0'
  ],
  y_colors: 'Purples',
  seed: Math.seedrandom('added entropy', {
    entropy: true
  })
});