Image credit: Shelly Fiabane
Local Weather App (Part 3)
Project Objectives:
- Create an app using the Open Weather API, and geolocation to display the user’s current weather conditions.
- Enable the background or an image to change based on conditions returned from the API call.
- Allow the user to toggle between Fahrenheit and Celsius.
Recap:
Blog post (Part 1) delved into the process of selecting color schemes and rendering several Trianglify backgrounds for the project. The focus of blog post (Part 2) was the use of console.log() messages and API calls. For this final post, my aim is to share the remainder of the code and what it does.
More About Trianglify
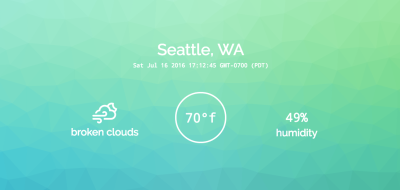
The final background image was rendered to a Canvas element by a call made within the base function (detailed in my previous blog post). This was a multi-layered process which: took data from the Open API call, passed it into a function which evaluated the data, and determined (by way of temperature range comparisons) which color palette to render to the DOM. Each color palette was a variable set to a Trianglify function..
See the evaluation function below:
//renders trianglify pattern/image to canvas based on the user's current temp range//
function backgroundImage(data) {

  if ($tempF <= 30 || $tempC <= -1.11) {
    lightPurple.canvas(document.getElementById('canvas1'))

  } else if ($tempF >= 31 && $tempF <= 40 || $tempC >= -1.12 && $tempC <= 4.44) {
    midPurple.canvas(document.getElementById('canvas1'))

  } else if ($tempF >= 41 && $tempF <= 50 || $tempC >= 4.45 && $tempC <= 10) {
    darkPurple.canvas(document.getElementById('canvas1'))

  } else if ($tempF >= 51 && $tempF <= 64 || $tempC >= 10.01 && $tempC <= 17.77) {
    blues.canvas(document.getElementById('canvas1'))

  } else if ($tempF >= 65 && $tempF <= 70 || $tempC >= 17.78 && $tempC <= 21.11) {
    blueGreen.canvas(document.getElementById('canvas1'))

  } else if ($tempF >= 71 && $tempF <= 84 || $tempC >= 21.12 && $tempC <= 28.88) {
    greenYellow.canvas(document.getElementById('canvas1'))

  } else if ($tempF >= 85 && $tempF <= 94 || $tempC >= 28.89 && $tempC <= 34.44) {
    yellowOrange.canvas(document.getElementById('canvas1'))

  } else if ($tempF >= 95 || $tempC >= 34.45) {
    orangeRed.canvas(document.getElementById('canvas1'))

  } else {
    defaults.canvas(document.getElementById('canvas1'))
  };
}
If for some reason the temperature was found to be outside of the defined ranges, the function will default to render a random Trianglify image.
* Side note: while working on the write-up, I realized a $tempF comparison was redundant. It was removed to dry up the project code.
Weather Icons
The Open Weather API call returns an icon code. This code can be used with the icons available on the Open Weather website. Unfortunately, the design of the Open Weather icons wasn't to my liking. Instead, I chose to use the Weather Icons created by Erik Flowers. These icons were built with Bootstrap in mind, and are compatible with the Open Weather API codes.
The API call returns an icon code as seen here:
![]()
Note the 'd', portion of the icon code which refers to the current time of day. At night the string will change to 'n'. The icon package includes an icon that corresponds to both day and night conditions. In order to display the proper icon, a function was written which determined whether it was currently day, or night. After determining the correct icon, the function then rendered it into an existing DOM element.
Here is the function:
//using the OWM api data to get the correct icon to display, creating a new class and adding it to the DOM//
function setIcon(data) {
  $dayNightIcon = data.weather[0].icon;
  $icon = data.weather[0].id;

  //determine based on data whether night/day and display relevant icon//
  if ($dayNightIcon.match(/[d]/i)) {
    $('#day-or-night').html($('<i>', {
      class: 'wi wi-owm-day-' + $icon
    }));

  } else if ($dayNightIcon.match(/[n]/i)) {
    $('#day-or-night').html($('<i>', {
      class: 'wi wi-owm-night-' + $icon
    }));
  }
}
Displaying Temperature with a Toggle:
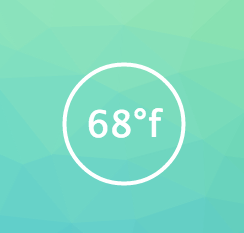
One project objective was for the temperature to be displayed with a user toggle for f° and c°. My personal goal within the objective: Render the temperature within a circle (drawn dynamically) based on the size of text it contained, while allowing the user to toggle c°/f° on mouse click. This goal was met by creating html5 Canvas elements to display the information in the DOM.
A Tiny Problem:
Originally, there were two hard coded Canvas elements in the html. The function I wrote would render each circle dynamically to the element (#circle1 or #circle2). The #circle2 element remained hidden until triggered by a click event.
Unfortunately, while structuring the CSS it became obvious this was not a viable method to render the data. The problem: upon toggle the entire look/structure of the DOM changed based on which circle was being rendered. A more experienced coder may have caught this while writing the js; However, for me this proved to be a real learning opportunity.
The Solution:
After doing some research, I found a clever (in my opinion) workaround to eliminate the issue. By using a library called jCanvas, I was able to create a click event triggered within the (#circle1) rendering function.
To take advantage of this new capability, a single html div element was (hard-coded) with an id of #circle. The $displayTempF function then needed to:
- Have the first action clear the contents of the #circle element (deleting the children elements).
- Create a new Canvas element with an id of #circle1 as a child of the #circle element.
- Render the text content of $tempF, and the circle surrounding it within the new Canvas element.
- Create a click handler in $displayTempF which would call the $displayTempC function.
The $displayTempF Function:
//draws the text (user's current temp) into a circle element, with °f visible until click event//
function $displayTempF(data) {
  $('#circle').html('');
  $('#circle').html('<canvas id="circle1" height="150" width="150"></canvas>');

  $('#circle1').drawText({
      layer: true,
      name: 'tempF',
      fillStyle: '#ffffff',
      strokeWidth: 1,
      x: 75,
      y: 75,
      fontSize: '3.6rem',
      fontFamily: 'Droid Sans Mono',
      text: $tempF + '°f'
    })
    //circle drawn/displayed based on size of containing text//
    .drawArc({
      layer: true,
      strokeStyle: '#ffffff',
      strokeWidth: 4,
      x: 75,
      y: 75,
      radius: $('#circle1').measureText("tempF").width / 1.25,
      click: function (data) {
        $displayTempC($temp);
      }
    })
}
The $displayTempC Function:
I'm not going to demonstrate the code for this function, because the only difference between it and $displayTempF is two variables. This function was also coded to clear the children of #circle, and create a Canvas element to render #circle2. The click event which triggered the $displayTempF function was written within this function exactly as demonstrated in the previous code example.
This was the last portion of JavaScript code written for the project. Please feel free to visit the Github Repository for a look at the code in it's entirety.
That’s All Folks!
Thank you for reading my blog. I really enjoyed working on this project and found writing about it very helpful. I ended up making several adjustments/edits, which were necessary to dry up the code. I'm not certain I would have been aware of the issues were it not for writing these blog posts.
Best of luck to those of you in the midst of a coding journey. Keep at it, and find me on Twitter let's talk about code! Check back soon for new project posts!
comments powered by Disqus